
# Audit logs
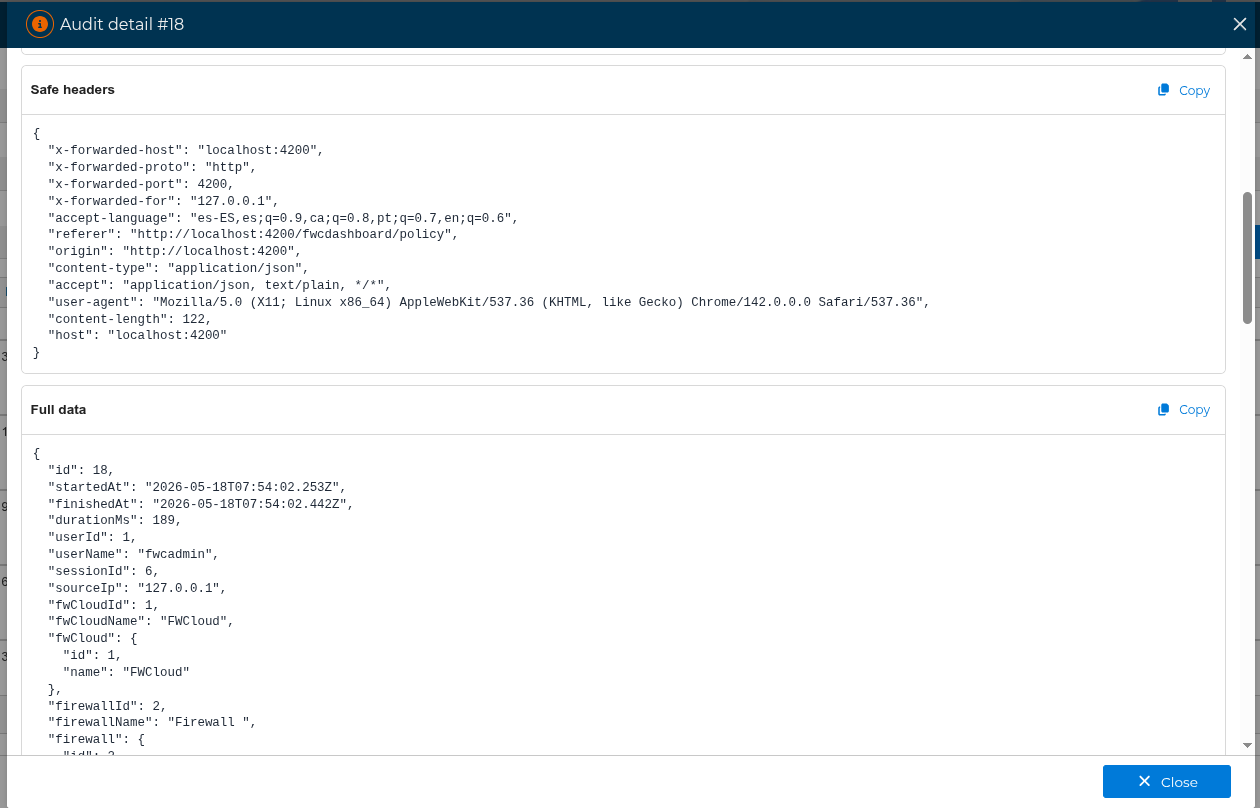
FWCloud stores an audit trail of mutating operations performed through the application. Each entry keeps the start time, the calculated end time when available, the request duration, the HTTP status, the user, the session identifier, the source IP address, the affected FWCloud, firewall or cluster, the API call, and a short human-readable description.
Read-only requests are not registered in this panel. Sensitive values such as passwords, tokens, API keys, cookies, and authorization headers are redacted before the audit entry is stored and before detailed payloads are displayed.
# Opening the audit log viewer
You can open the audit log panel from several places in the interface:
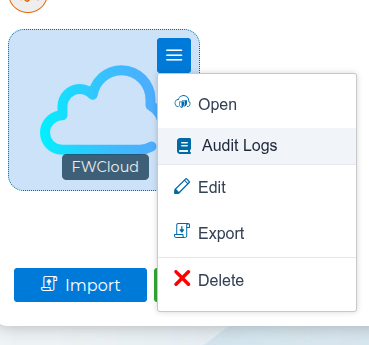
- From the main FWCloud screen, click the blue book icon in the top toolbar to open the global audit log viewer.

- From the FWCloud list, open the cloud menu and select
Logsto show the entries related to the selected FWCloud.
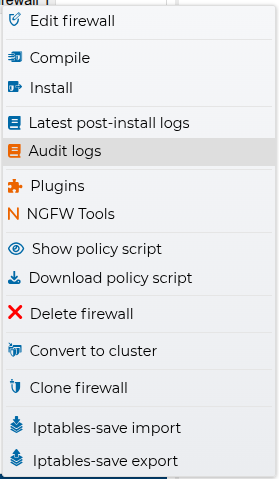
- From the firewall or cluster context menu, select
Audit logsto show the entries related to that object.
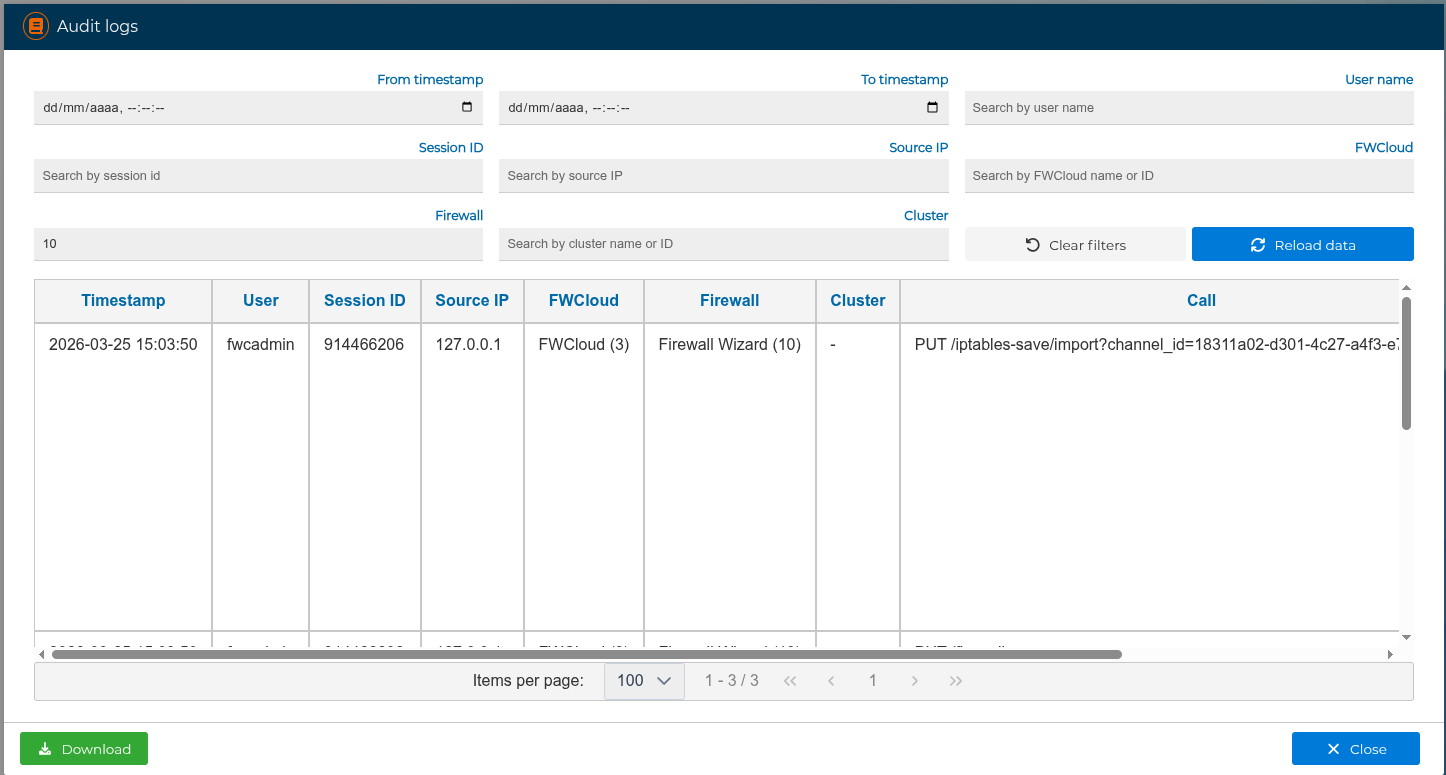
When the panel is opened from a FWCloud, firewall, or cluster, the related filters are prefilled. The selected FWCloud remains pinned by its numeric identifier, so the query stays inside that FWCloud even if other objects have the same name. Firewall and cluster filters can be edited or cleared to broaden the search inside the selected FWCloud.
# Filtering and navigation
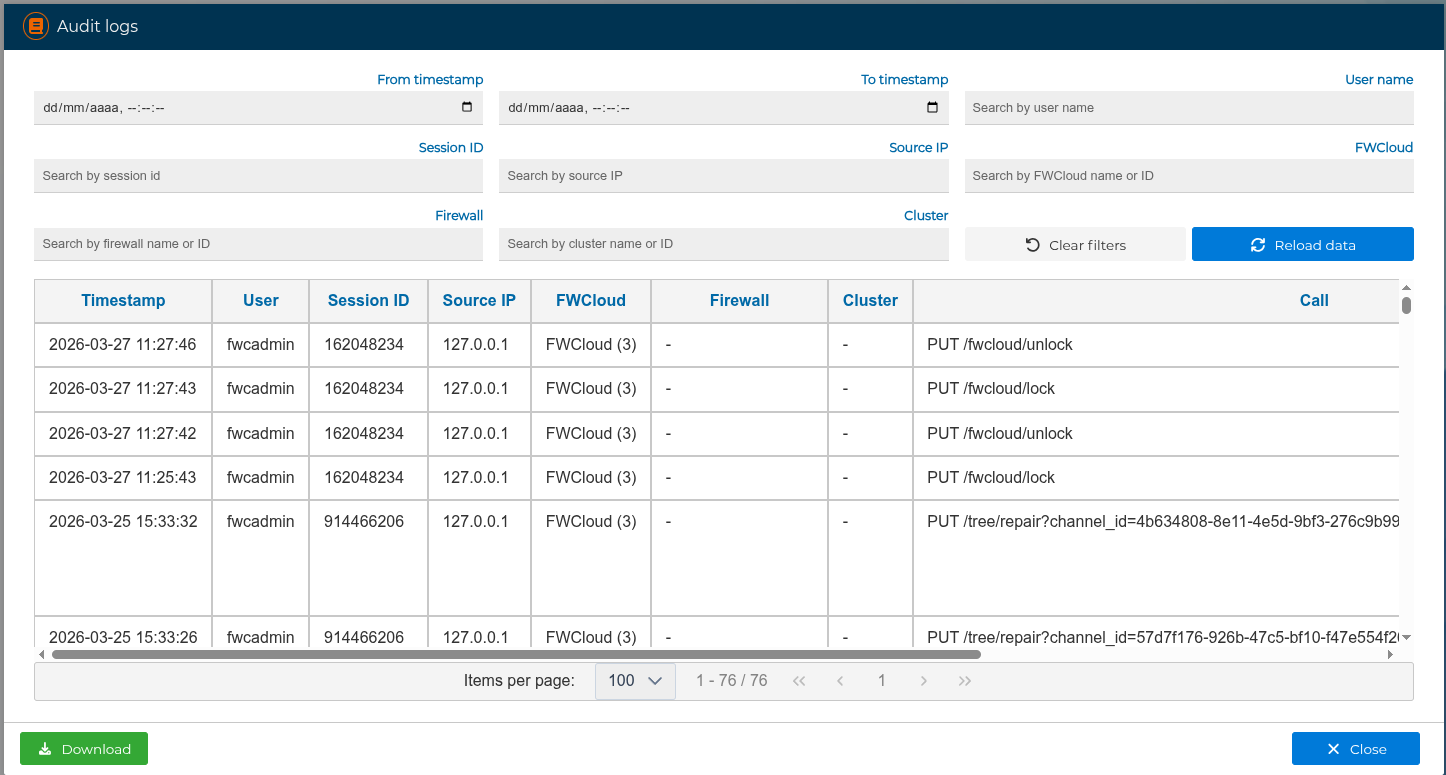
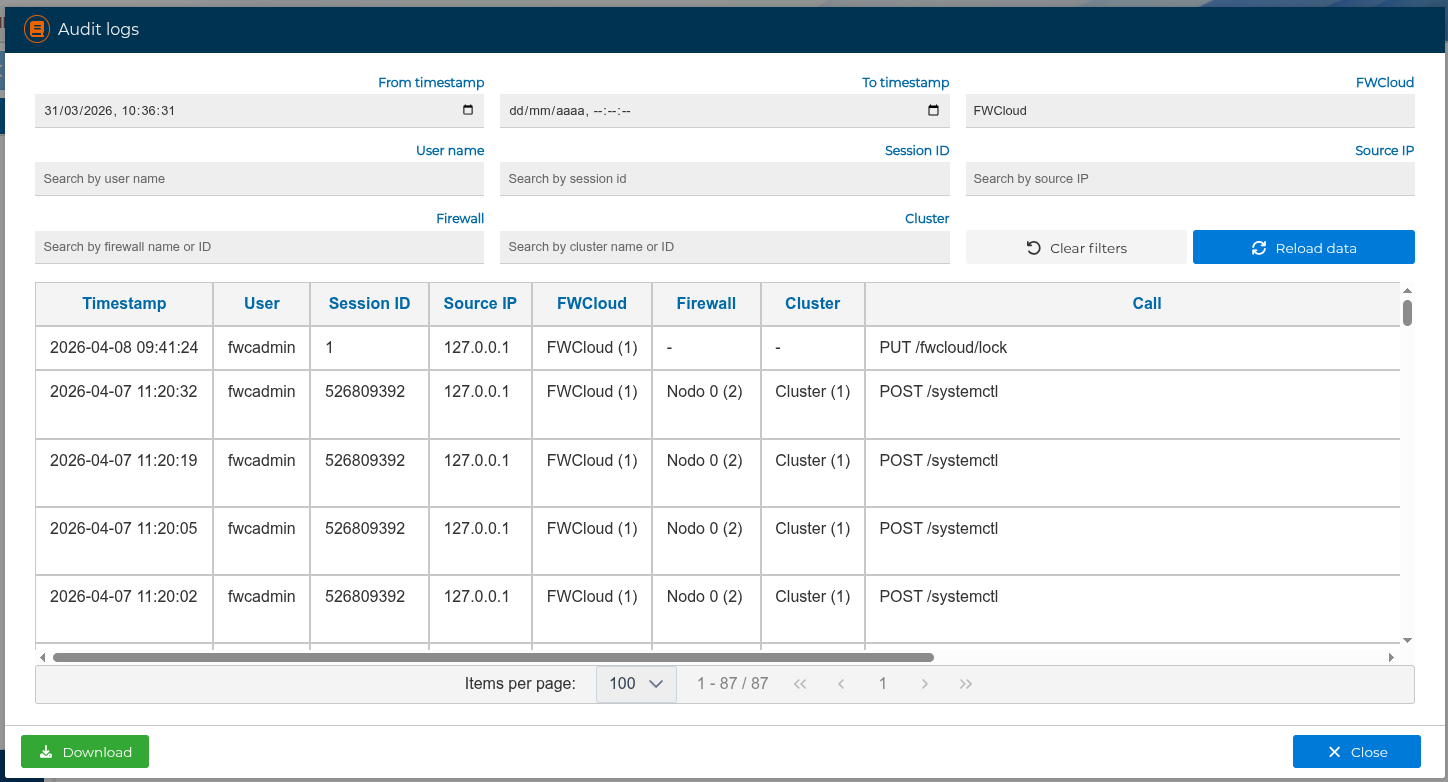
The audit log panel provides the following filters:
Start time fromStart time toUser nameSession IDSource IPFWCloudFirewallCluster
FWCloud, firewall, and cluster filters accept either the object name or its numeric identifier. In the results table these objects are displayed with their name and ID, for example Production FW (10).
The table uses server-side pagination, so the filters are applied directly in FWCloud-API. The selected rows-per-page value and the last filters used are kept in the browser, so they are restored the next time the panel is opened.
The results table includes:
Start: when the operation began.End: when the operation finished, calculated from the start time and duration when the API provides this information.Duration: request or internal task duration in milliseconds or seconds.Status: HTTP status code for API requests. Successful responses are shown as success badges, authorization or not-found responses as warning badges, and other errors as error badges.Description: a normalized summary of the operation.
For narrow screens, the panel switches to a compact card layout with the same information.
# Audit log details
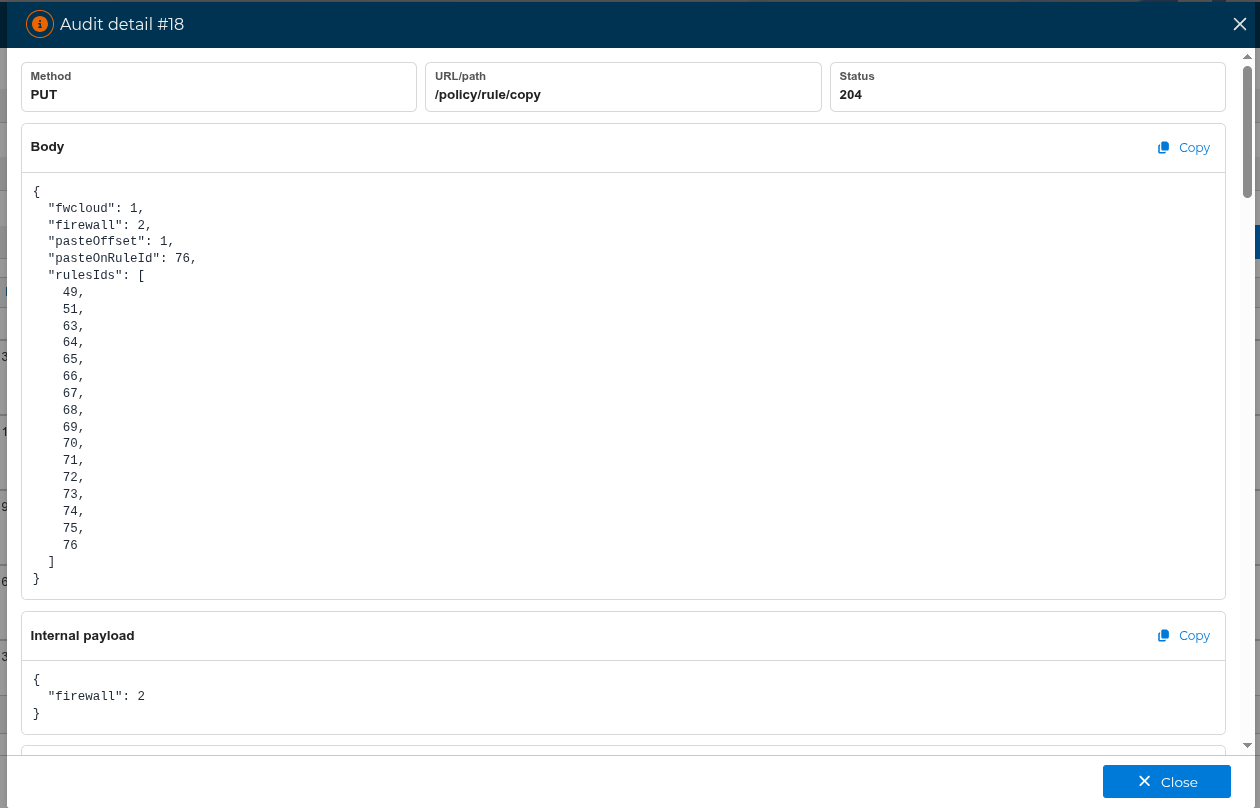
Use the +Info action in a row to open the detailed audit entry. The detail is loaded only when requested, so the main list can remain fast and avoid downloading full payloads for every row.
The detail window can show:
- Request summary: method, URL or path, and status.
Params: route parameters.Query strings: request query values.Body: request body values.Internal payload: payloads generated by internal events.Safe headers: only non-sensitive headers.Cron/worker/import: runtime context for internal tasks.Full data: the complete sanitized payload available for that audit entry.
Each section can be copied with the Copy button. Sensitive values remain masked in the detail view.
# Latest post-install logs
From the firewall and cluster context menus you can also open Latest post-install logs. This uses the same audit log panel, but it preloads the Start time from filter with the latest installation date of the selected firewall or cluster.
For clusters, FWCloud uses the most recent installation date among the cluster nodes. If the object has never been installed, FWCloud uses its creation date as the initial reference instead. When an installation date exists, the search starts just after that timestamp so the installation entry itself is not included. This view is useful to review the changes made after the last deployment.
# Downloading and permissions
The Download button exports the currently displayed rows to a JSON file. It exports the visible list data, not every detailed payload behind the +Info action. This is useful for external review, incident analysis, or sharing a filtered subset of the audit trail.
Administrators can query the complete audit log dataset. Non-administrator users can only see entries associated with their own user or current session.
If internal audit logging is enabled on the server, this same panel can also show background events generated by internal processes such as cron tasks, workers, archivers, and import tasks. These entries use a system user and include their runtime context in the detail view.
To configure how long audit entries remain in the live database and archive files, visit Audit log history archiver .